
Dear ESB members,
Registration is still open for the first 2026 ESB Webinar, organised by the ESB Education and Early Career Committee.
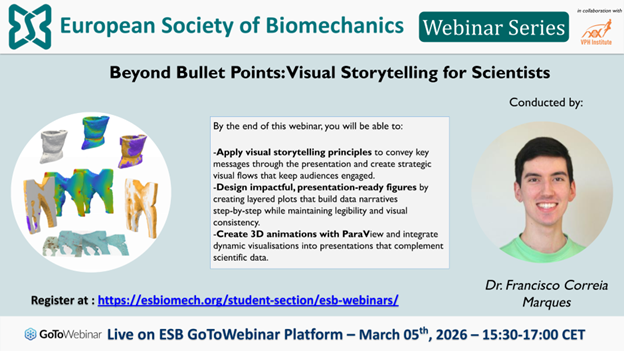
Title: Beyond Bullet Points: Visual Storytelling for Scientists
Speaker: Dr. Francisco Correia Marques (Postdoc at the Institute for Biomechanics – ETH Zurich)
Date: Thursday, 5 March 2026, 15:30 CET
Abstract:
This webinar will explore how visual storytelling in scientific communication can transform complex research into memorable, engaging narratives. Moving beyond traditional bullet-point presentations, the session will cover key principles for creating impactful presentations, from crafting clear visual messages to captivating stories based on your data. Drawing examples from computational biomechanics and advanced imaging, participants will learn practical workflows for designing presentation-ready figures, leveraging open-source tools like ParaView for high-quality 3D animations, and using visual elements to enhance clarity. Through live demonstrations, attendees will discover techniques for embedding dynamic visualisations, optimising plots for legibility, and maintaining visual continuity to create cohesive storytelling experiences.
Short bio:
Dr Francisco C. Marques is a computational biology researcher at the Institute for Biomechanics, ETH Zürich. His work specialises in advanced multimodal imaging approaches to understand bone mechanobiology across multiple scales. He has made significant contributions to bone biomechanics and correlative imaging methodologies, notably by developing Spatial μProBe, a tool for integrating 3D micro-CT with spatial transcriptomics data. His work bridging computational biology, image analysis, and biomechanics has been recognised by various awards including the ETH Medal for Outstanding Doctoral Thesis, the ESB Student Award, and the ISBM Top Abstract Award. Beyond research, Francisco is passionate about science communication, creating high-quality scientific visualisations and animations with open-source tools like ParaView and Generative AI to communicate complex scientific concepts through compelling and memorable visual narratives.
Learning goals
By the end of this webinar, you will be able to:
- Apply visual storytelling principles to convey key messages through the presentation and create strategic visual flows that keep audiences engaged.
- Design impactful, presentation-ready figures by creating layered plots that build data narratives step-by-step while maintaining legibility and visual consistency.
- Create 3D animations with ParaView and integrate dynamic visualisations into presentations that complement scientific data.
Best regards,
ESB Education and Early Career committee